Reporting
Our clients tell us our reports are the best in the business, and we’re inclined to agree.
Detailed criteria scoring and feedback
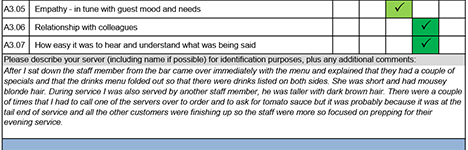
We provide a comprehensive report for every visit, every outlet. You tell us how much detail and feedback you want, and we’ll provide it. Every touch-point assessed is graded by our assessors so that you know how well each criterion was met, and candid, constructive commentary is provided not just at the end, but throughout every section of the report where the assessor feels it appropriate and/or the client requests specific feedback.
Eye-catching action points
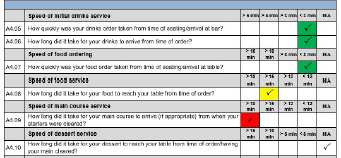
We know that our clients will often only have time for a cursory glance before attending to the next challenge of their day. We’ve designed our reports so that underperforming criteria show yellow or red so that you can instantly focus on the areas of your business that require the most attention. All green, and things are probably OK.
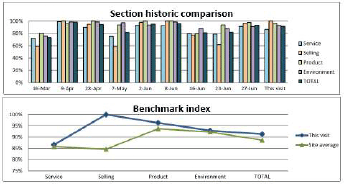
Trend analysis
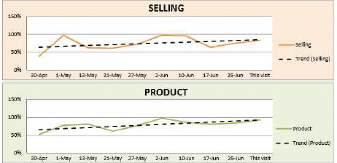
Our reports provide a detailed trend analysis for each section so that you can easily track improvements or slipping standards over time. Section and overall result percentages are also mapped against previous visits to inform your own KPIs, and we can also benchmark your venue’s performance to a basket of industry competitors on request.
Response grids
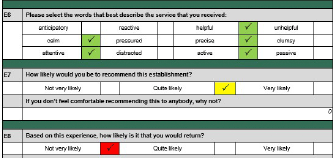
It’s a bit like conducting a free market research campaign every time your establishment is inspected. Our Invisible Guests are asked to select words that best describe your team’s behaviours and the service they received, as well as provide an indication of how likely they would be to happily visit the premises again and recommend your business to others.
Powerful, easy to digest summaries
We’ve worked hard to provide quick ways to convey basic results information for time-poor clients. Our reports always include an executive summary section providing at-a-glance dashboard performance indicators and key summary findings.